
Central Limit Theorem in R; CLT states that, regardless of the population’s distribution, the distribution of the sample means will be approximately normally distributed if the sample size is sufficiently large. This is a powerful tool that helps us draw accurate inferences about the population based on samples.
Understanding the Central Limit Theorem
Before we delve into implementing the CLT, let’s grasp the key aspects of this theorem:
- Population and Sample Mean:
- The population mean (\mu) is the mean of the entire population.
- The sample mean (\bar{X}) is the mean of a sample taken from the population.
2. Sampling Distribution of the Sample Mean:
- The CLT focuses on the distribution of the sample means.
- It states that as we take more samples and calculate their means, these means will form a normal distribution.
3. Sample Size Matters:
- Larger sample sizes lead to a sampling distribution that is closer to a normal distribution.
- The standard deviation of the sample mean (\frac{\sigma}{\sqrt{n}}) decreases as the sample size (n) increases.
check out our central limit theorem calculator for FREE
Setting Up the Environment in R
We’ll primarily use the ‘ggplot2’ package for data visualization. Install it using the following command if needed:
install.packages("ggplot2") Example: Applying the Central Limit Theorem in R
Let’s begin by generating a sample dataset. For simplicity, we’ll generate a dataset containing random numbers, but in real-world scenarios, this dataset could represent any data you’re working with.
set.seed(123)  # Setting seed for reproducibility
sample_data <- rnorm(1000, mean = 50, sd = 10)
In this example, we’re generating a dataset of 1000 random numbers from a normal distribution with a mean of 50 and a standard deviation of 10.
Calculating Sample Means and Implementing CLT
Now, we’ll calculate the sample means to observe the CLT in action. We’ll take different sample sizes (e.g., 10, 30, 100) and calculate the means for each.
# Sample sizes
sample_sizes <- c(10, 30, 100)

# Calculate sample means
sample_means <- lapply(sample_sizes, function(n) {
  replicate(1000, mean(sample(sample_data, n)))
})
Here, we’re calculating the sample means for each sample size specified in sample_sizes.
Visualizing the Results
Let’s visualize the sampling distribution of the sample means for different sample sizes. We’ll use the ‘ggplot2’ package for this purpose.
library(ggplot2)

# Creating a data frame for visualization
df <- data.frame(
  sample_mean = unlist(sample_means),
  sample_size = rep(sample_sizes, each = 1000)
)

# Plotting the sampling distribution
ggplot(df, aes(x = sample_mean, fill = factor(sample_size))) +
  geom_density(alpha = 0.5) +
  theme_minimal() +
  labs(title = "Sampling Distribution of Sample Means",
       x = "Sample Mean",
       y = "Density") +
  scale_fill_discrete(name = "Sample Size")
This code will generate a plot showing the sampling distribution of the sample means for different sample sizes.
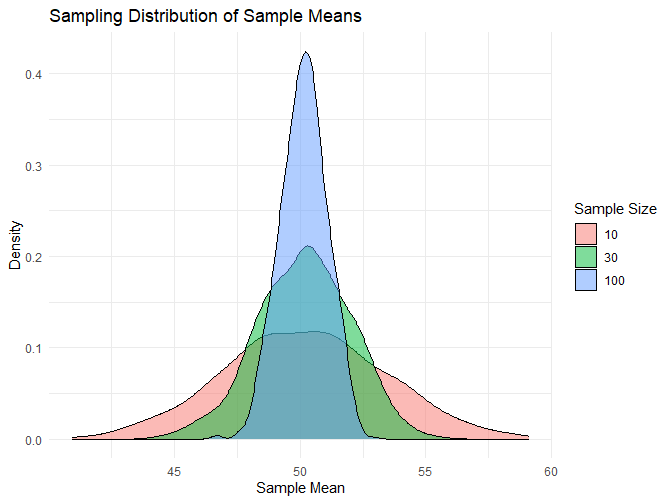
Interpreting Results and Drawing Conclusions
By observing the plotted sampling distributions, we can see how they converge to a normal distribution as the sample size increases. This aligns with the Central Limit Theorem, illustrating its practical application in statistical analysis.
Practical Applications and Use Cases
Example 1: Examining Test Scores
Imagine you are an educator analyzing the test scores of students in a school. You collect 500 test scores from the entire student population. However, analyzing the entire dataset is overwhelming. Applying the Central Limit Theorem allows you to take multiple random samples from the 500 scores, calculate the sample means, and visualize how these means form a bell-shaped distribution. This aids in understanding the average performance of students and the variability in scores, which is essential for designing effective teaching strategies.
Example 2: Customer Satisfaction in an E-commerce Platform
Suppose you work for an e-commerce platform that wants to assess customer satisfaction. The company has millions of customers, and obtaining feedback from all of them is impractical. By applying the CLT, you can take random samples of customer feedback, calculate the mean satisfaction score for each sample, and visualize how these means are distributed. This allows you to estimate the overall customer satisfaction level with a certain confidence interval, aiding in decision-making to improve services and user experience.
Example 3: Quality Control in Manufacturing
In a manufacturing plant, you’re concerned about the weight of a specific product being produced. Measuring the weight of every single product is not feasible due to time and cost constraints. By applying the CLT, you can take random samples of the products, calculate the mean weight for each sample, and create a sampling distribution of the means. This helps in understanding the average weight and the variation, ensuring the product meets quality standards.
Example 4: Financial Investments and Portfolio Management
As a financial analyst, you want to analyze the returns of various stocks in a stock market. Instead of analyzing every stock, you can randomly select samples of stocks, calculate their average daily returns, and plot the distribution of these means. Applying the CLT helps in understanding the average return and risk associated with the portfolio. This is crucial for investors and fund managers to make informed decisions and optimize their portfolios..
Conclusion
Implementing the Central Limit Theorem in R provides a deeper understanding of this essential statistical concept. It allows you to analyze data more effectively and make informed decisions based on statistical principles. By applying the CLT, you unlock the ability to draw meaningful conclusions from sample data, a skill that is invaluable in the field of statistics and data analysis.