Introduction
Plotting function curves is a fundamental task in data analysis and visualization. R, a powerful statistical programming language, offers various tools and libraries that make it easy to generate and customize function plots. In this blog post, we will explore a step-by-step guide on how to plot a function curve in R.
Step 1: Install and Load Required Packages:
Before we begin, ensure that you have R installed on your system. To plot function curves, we will be using the “ggplot2” package, one of the most popular and versatile packages for data visualization in R. If you don’t have the package installed, use the following command to install it:
install.packages("ggplot2")
To load the package into your R session, use the library function:
library(ggplot2)
Step 2: Define the Function:
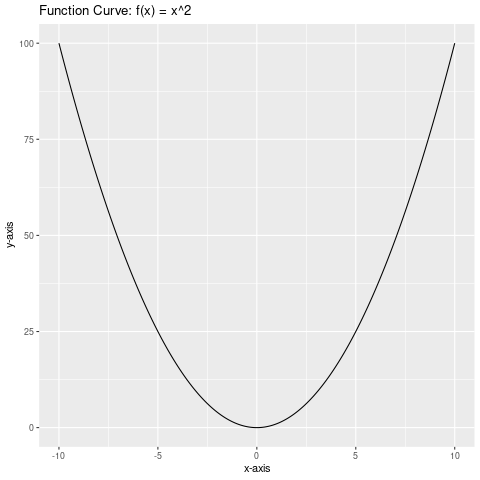
Next, define the function you want to plot. For example, let’s say we want to plot the function f(x) = x^2:
f <- function(x) {
  return(x^2)
}
Step 3: Generate Data Points:
To plot a function curve, we need to generate a set of data points by evaluating the function over a range of x-values. In this example, we’ll create a sequence of x-values from -10 to 10 with a step size of 0.1:
x <- seq(-10, 10, 0.1)
y <- f(x)
Step 4: Create the Plot:
Now that we have the x and y values, we can create the function plot using ggplot2. Start by calling the ggplot function and specifying the data frame that contains the x and y values:
plot <- ggplot(data.frame(x = x, y = y), aes(x, y))
Step 5: Add the Function Curve:
To add the function curve to the plot, use the geom_line function. It connects the data points with a continuous line:
plot <- plot + geom_line()
Step 6: Customize the Plot (Optional):
You can customize the plot further by adding axis labels, a title, adjusting colors, line types, and more. Here’s an example of adding labels and a title to the plot:
plot <- plot + xlab("x-axis") + ylab("y-axis") + ggtitle("Function Curve: f(x) = x^2")
Step 7: Display the Plot:
To display the plot, simply call the variable name of the plot object:
plot
Conclusion:
In this blog post, we walked through a step-by-step guide on how to plot a function curve in R using the ggplot2 package. By following these instructions, you can easily generate function plots and customize them to meet your specific needs. Experiment with different functions and explore the extensive capabilities of R’s plotting ecosystem to create visually appealing and informative plots. Happy plotting!